
I’ve recently purchased the NanoVNA produced by HCXQS at their store. I’m quite impressed with the product for the price. 50kHz – 4.4GHz T/R Network Analyzer w/ 70dB of dynamic range for S21, and 40dB of dynamic range for S11 measurements for 200.00USD. Th unit is equipped with a touch screen for control and obviously displaying results. In addition, there is a built-in 18650 cell for portable use.
I don’t have much to say about the UI/UX experience because I’ve never used it. The device has the ability to be remotely controlled over a serial interface (through USB). The remote interface offers a large number of points per sweep ( 10,000+, built in UI is limited) and all the niceties of using a modern computer when it comes to display, processing and storage. HCXQS has a program called NanoVNA-Qt to remotely control the unit. There is another program called NanoVNA-Saver, also Qt based but written in Python, with near identical functionality.
Using the documentation supplied by HCXQS and the NanoVNA-Saver repo as a base (except for calibration – I straight up ripped that code from the NanoVNA-Saver repo), I’ve created a small python package for collecting data from the NanoVNA.
Below is an example listing connecting to the unit, loading a calibration file, and performing a measurement.
# script constants
data_root = Path('../data').resolve()
cal_path = data_root / 'cal'

# get interface
iface = get_interfaces()[0]
iface.open()
vna = NanoVNA_V2_H4(iface)
vna.load_cal(cal_path)
vna.set_sweep(140e6,4.4e9,1001)

# measure
f, s11, s21 = vna.measure()
Scripting to the Moon
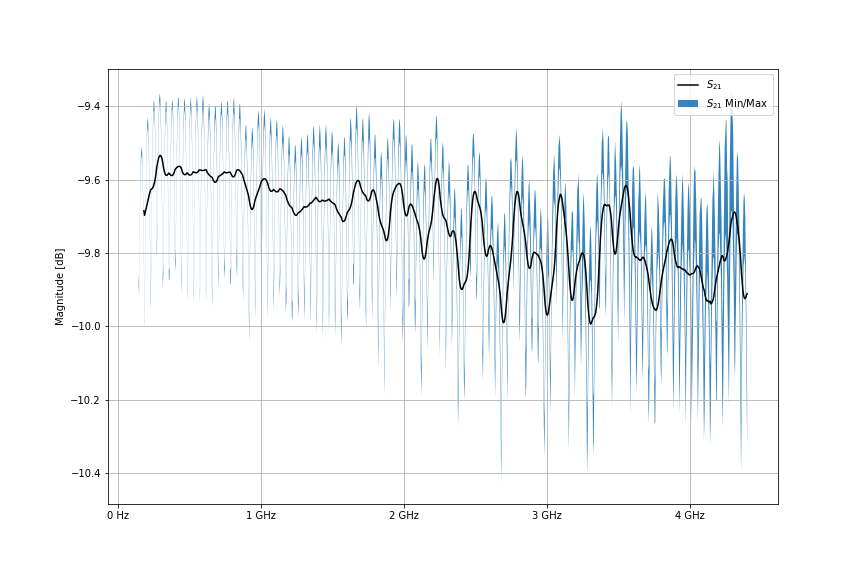
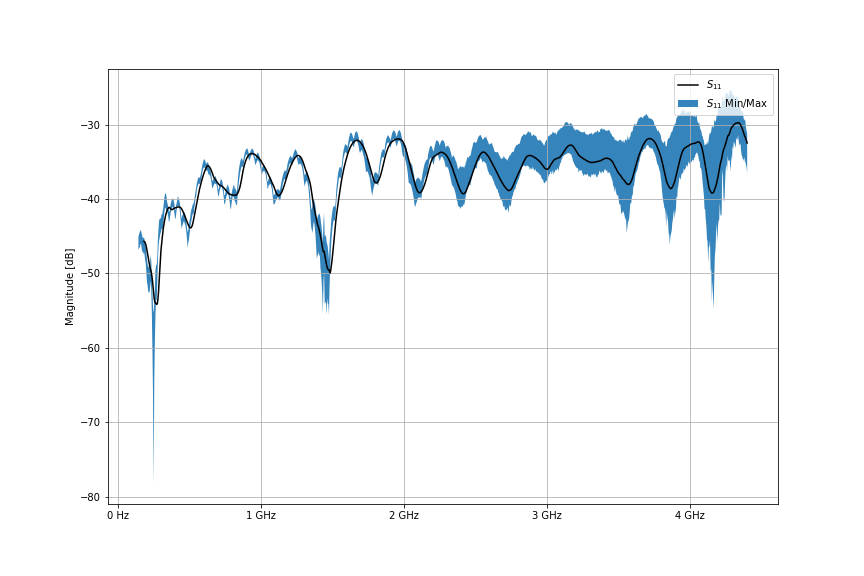
I create a basic script to test my package. The script requests 2,000 sweeps of 1001 points of a NooElec 10dB attenuator. This data is then slightly post-processed and graphed. We can see 0.5 dB of variation across the S21 measurements, and significantly more, (5-7 db), above 3GHz for S11 measurements. It should be noted, we are just above the noise floor (or maybe sitting on it) for these S11 measurements.
Please let me know if you’d find such a package useful. It is currently public on my repository, but it’s bit ‘how you doin’ at this time. I’ll be using this device to collect s-parameters from TI’s CC1200 RF transceiver IC next. TI does not provide optimal matching parameter data for all the operating bands. Therefore, I’m attempting to take manners into my own hands / VNA.