I’ve recently been forced to work on an antenna matching issue at work which has been fun and terrifying at the same time (my favorite combination personally). See, I don’t have any traditional RF experience. Everything has been learned on the job / via independent studies; therefore, there I have quite a few gaps I’m trying to fill.
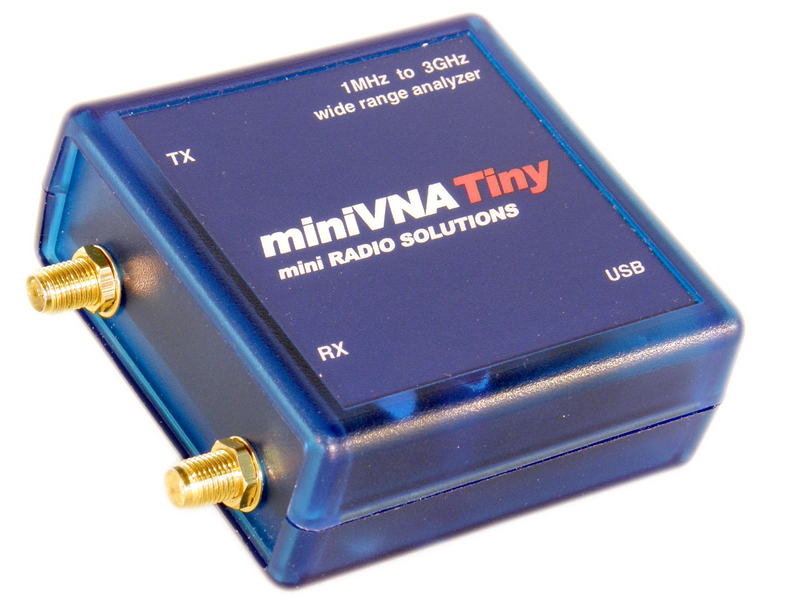
I purchased a miniVNA Tiny to continue my studies at home: http://miniradiosolutions.com/
The miniVNA tiny runs between $350-$600 dollars which is two to three orders of magnitude less than a traditional professional VNA new or used. That being said, I didn’t expect much. The best part was I didn’t even really know what to expect because I didn’t know what was important :). I thought measuring the reflected power on a few antennas I had laying around would interest people.
VNA Comparison
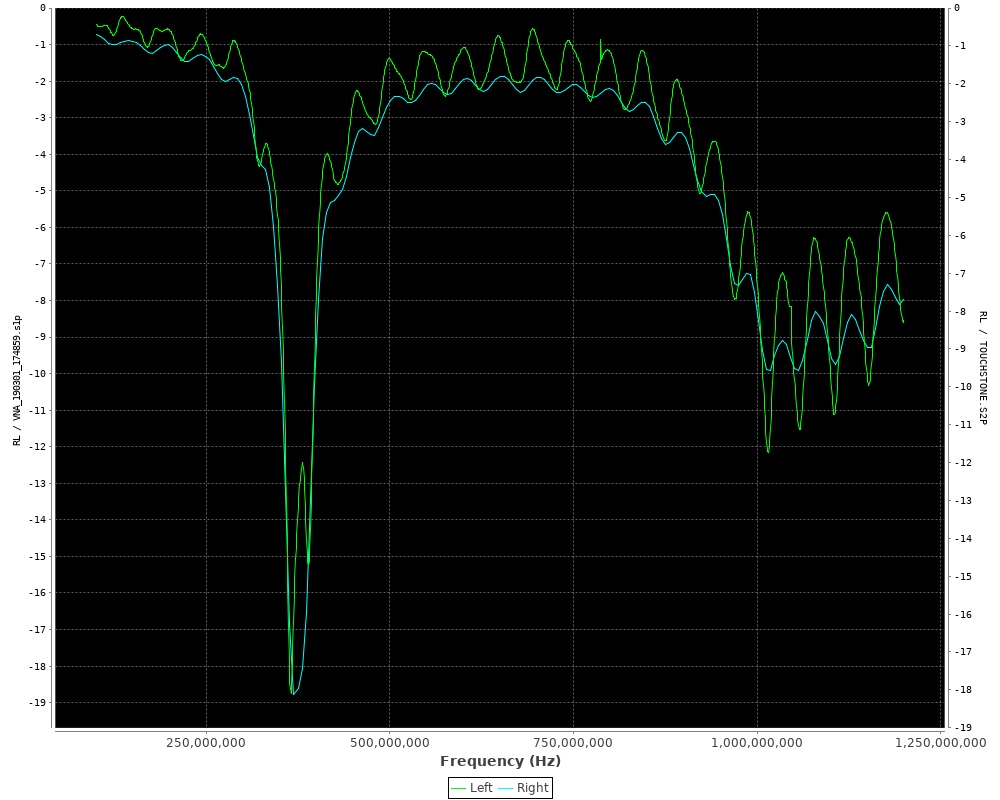
At work we have an Agilent E5071C (running Windows XP) with the ECalibration kit (yaas). The green traces are the miniVNA and blue is the Agilent device.
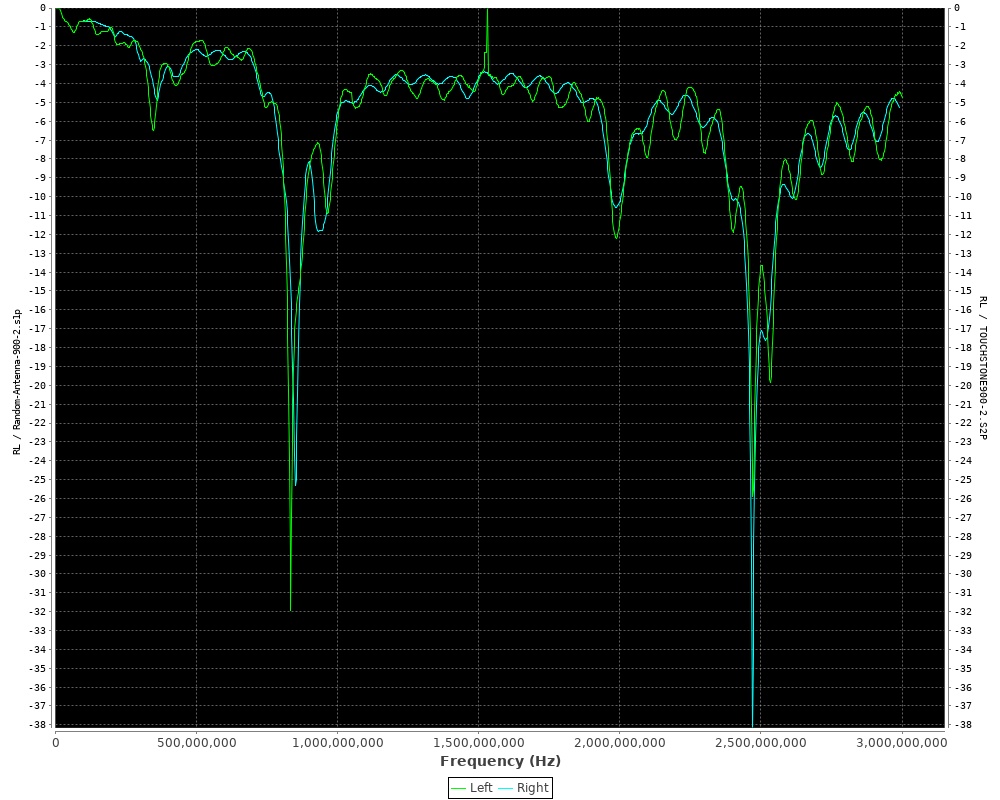
The first two antennas are monopoles which came with a RTL-SDR based SDR. I’m guessing they’re aircraft bands? The measurements between the two VNAs are quite close. The antenna base is a mag-mount which I placed on the most hearty ground plane I could find. This was my most repeatable test. These sweeps are from 100MHz to 1.2GHz The other tests have the antenna support via a cardboard box sitting on top of the same ground plane. They consist of sweeps from 100MHz to 3GHz.
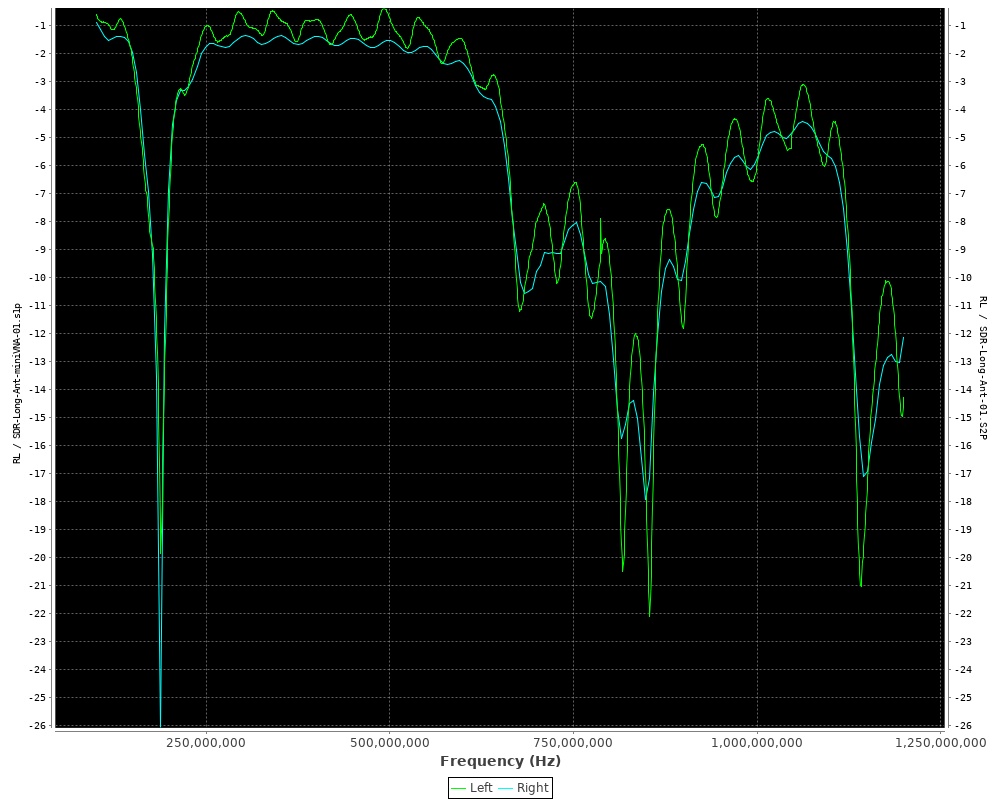
I don’t like the squiggles in the miniVNA measurement. I’m not sure what the cause is or what to call them? Increasing the calibration points in the range of measurement did not seem to improve the measurement. I believe the Agilent’s output power is higher, but I didn’t see a difference in measurements when I dropped it to -20dBm. I believe whatever these squiggles are the difference in the pass regions.
[Update]: The squiggles are entirely related to the calibration setup. The antennas supplied with a fixed coaxial cable which is huge no-no when performing VNA measurements unless the cable itself it attached during the calibration.
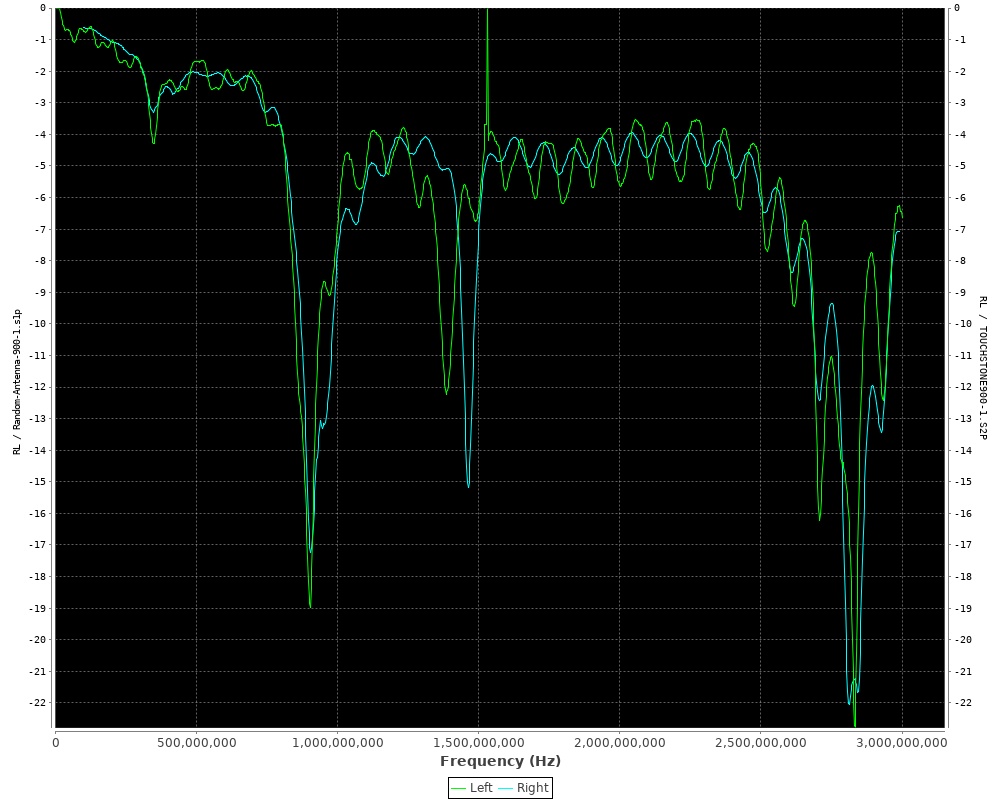
The next two antennas are in the 900MHz / ISM band. I believe their results are quite respectable. You can see a spike around 1.5GHz. It was impossible to remove this with calibration and averaging. It’s advertised the dynamic range of the miniVNA is suppose to be 50dB at 500MHz. I would like to know how to measure the dynamic range for it’s entire operating range so I could estimate if my intended measurement is impossible.
The forth comparison is quite different. It’s likely my fault as this was quite an ad-hoc setup and performed on my lunch break.
Dynamic Range Testing
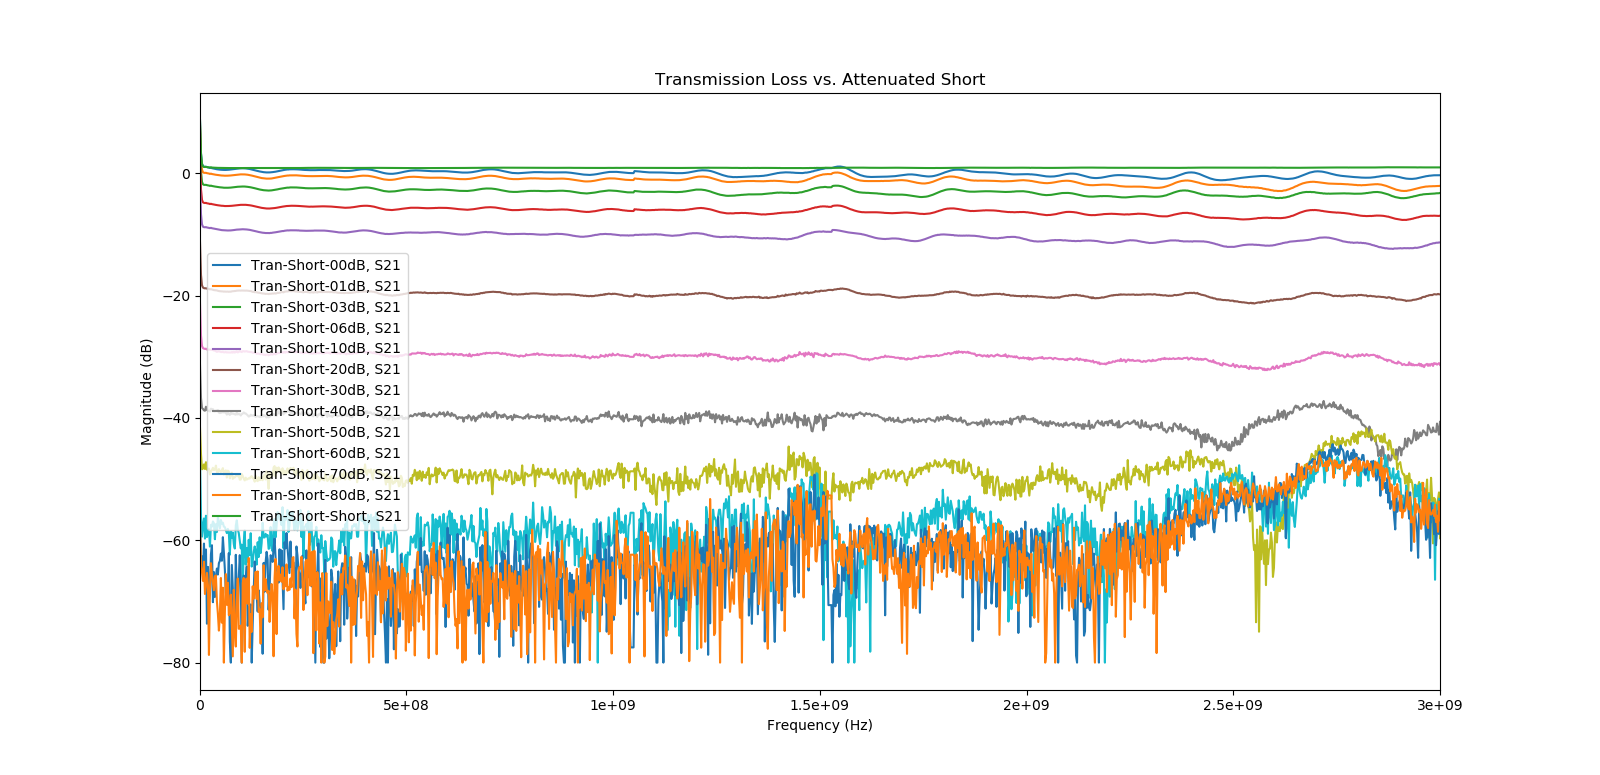
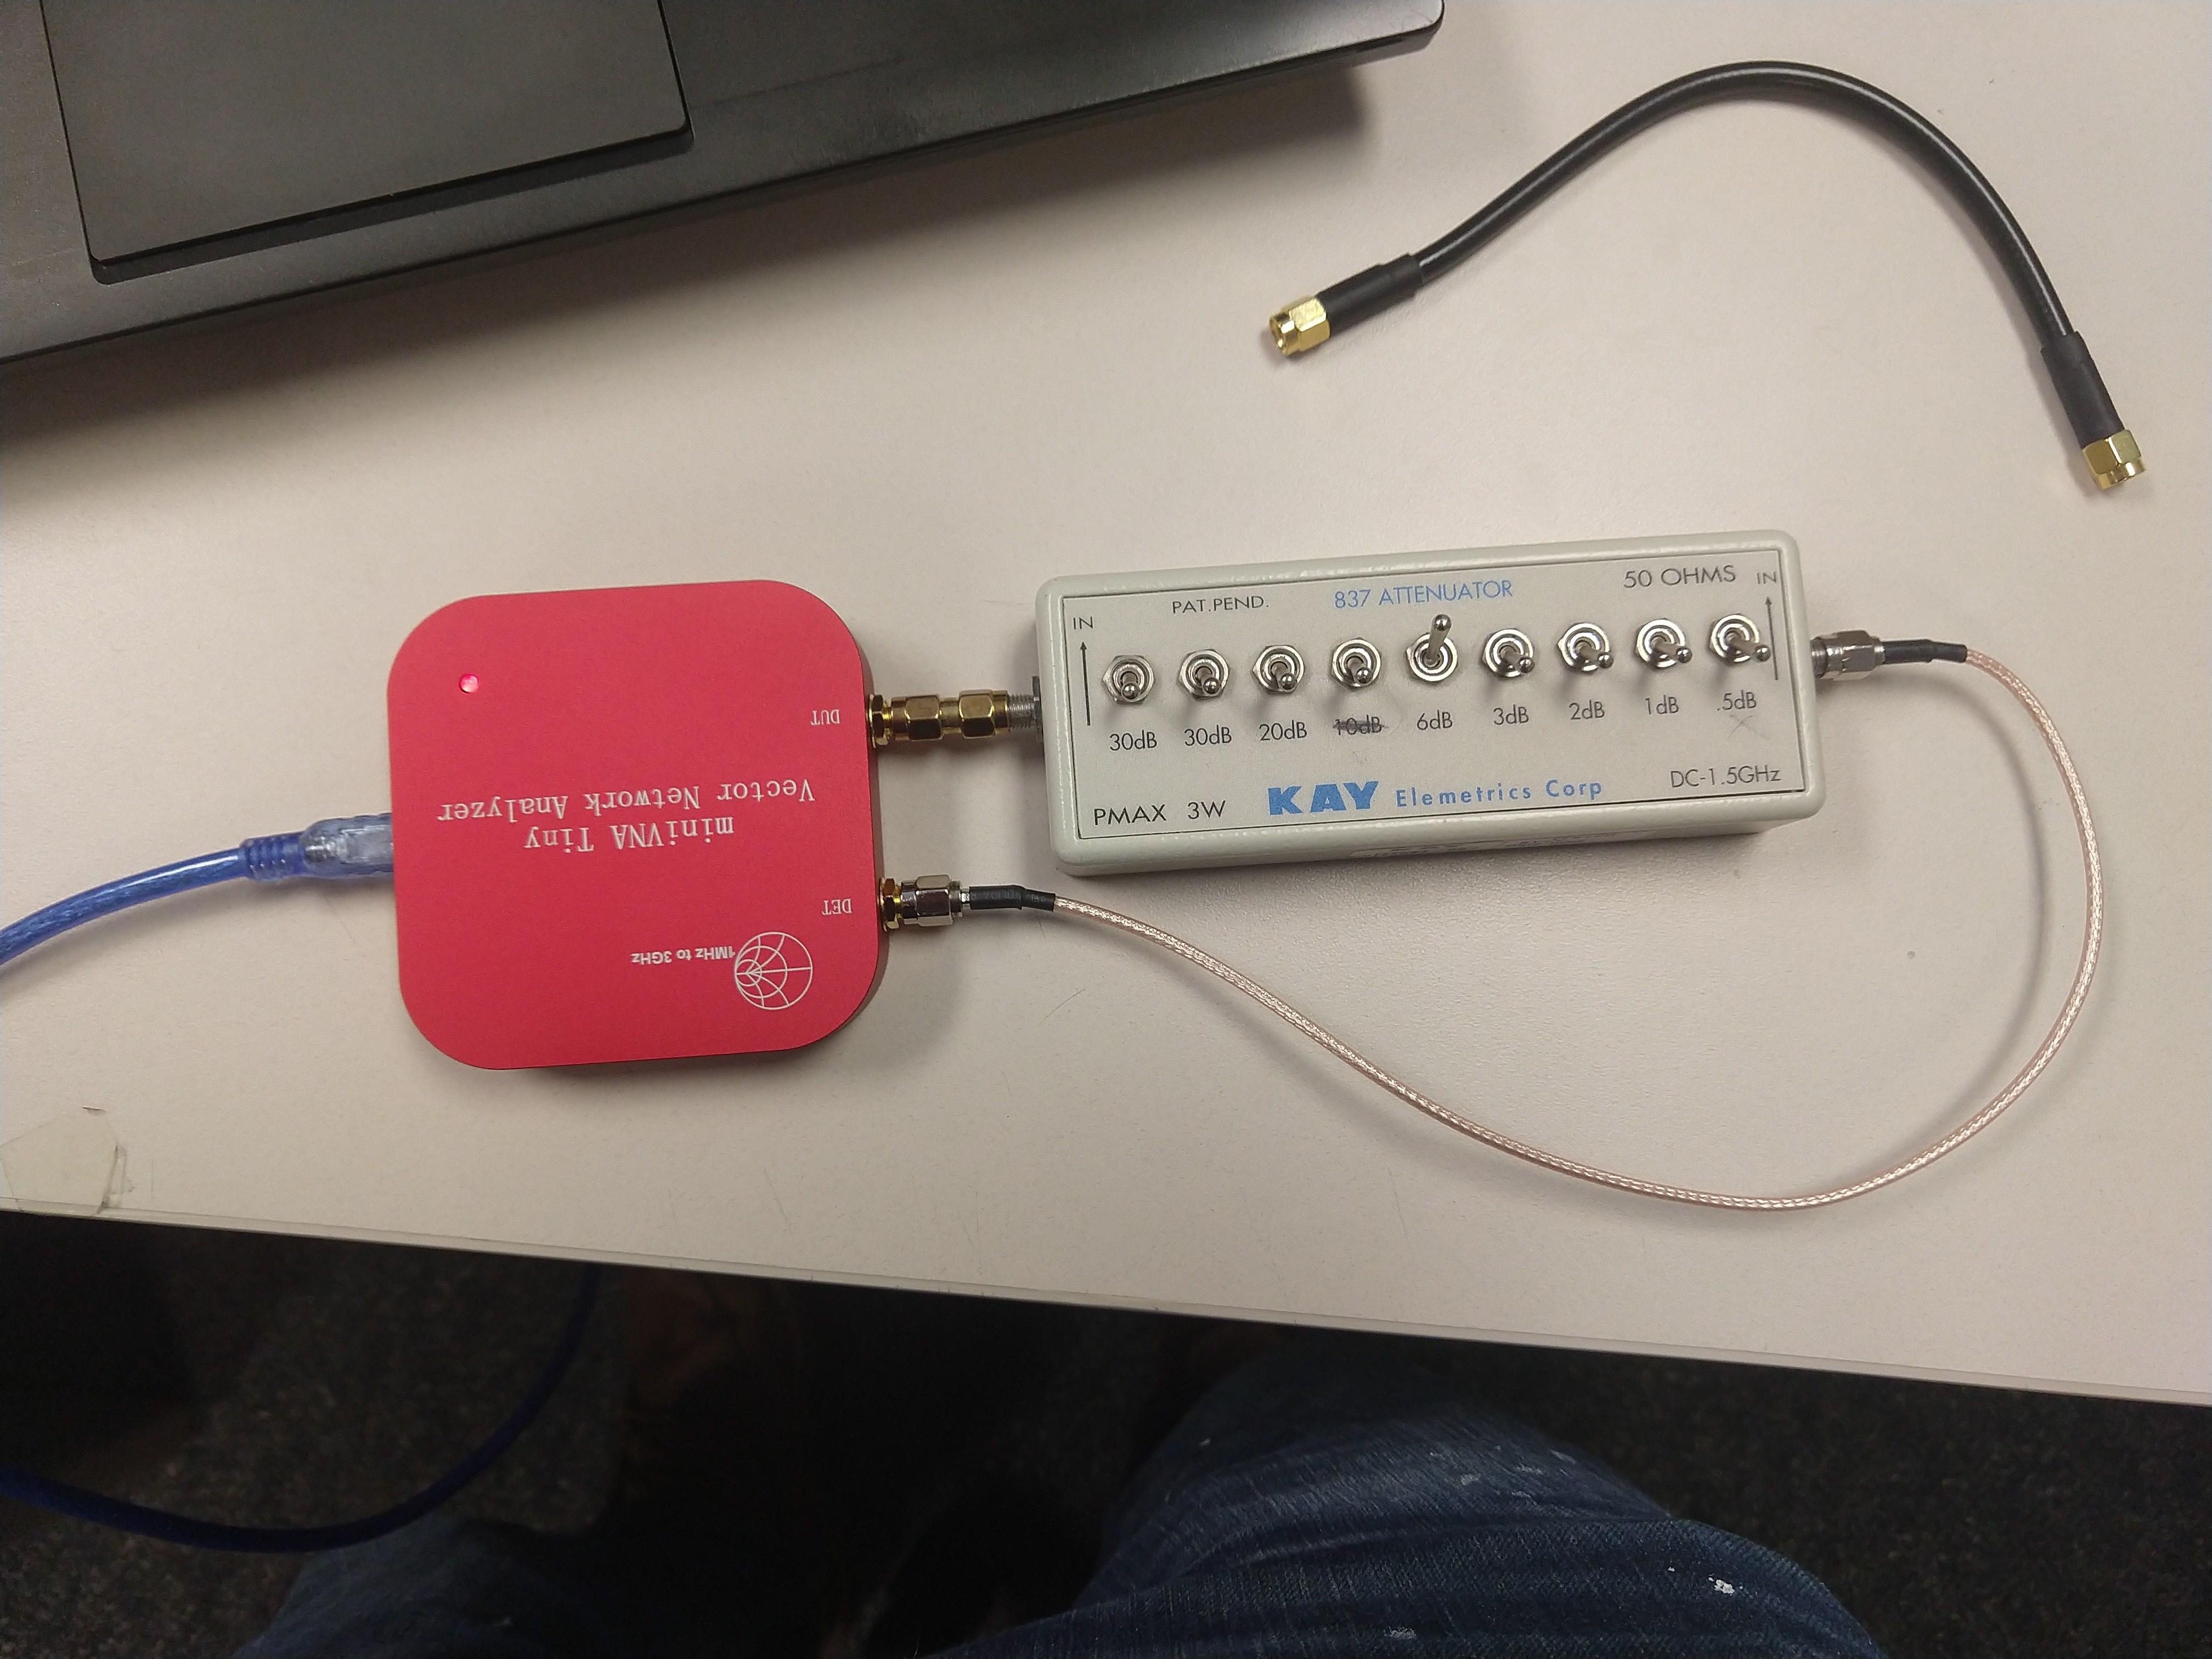
I put 10 seconds of thought into how I could measure the dynamic range of the miniVNA when measuring transmission or reflected powered, and I thought I figured it out. I decided I would use a variable RF attenuator.
For the transmission measurement, the RF attenuator was placed between the DUT and the DET ports. The lost should be equal to the set RF attenuator and remain flat across the spec’d range for the attenuator (so I assumed). The attenuator I was using was spec’d from DC to 1.5GHz.
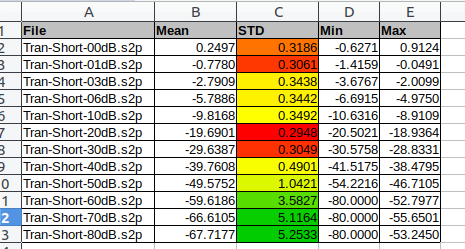
Luckily, I was right for once. The plot’s legend lists the amount of attenuation selected in dB. The x-axis is frequency, and the y-axis is power measured at the DET port. The following tables shows some basic statistics from 1MHz to 1.5GHz. There appeared to be a constant 0.3 to 0.24 dB error.